
Solution
Incident Triage and Correlation
Collapsing four thousand alarms into one event is necessary and nowhere near sufficient. What matters is whether the event that survives arrives carrying a cause, or just arrives as a shorter list.
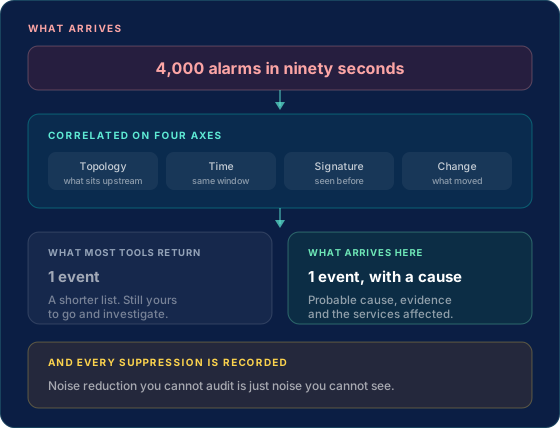
- Four axesTopology, time window, signature and change, rather than time-window grouping alone.How the join is made
- On arrivalCorrelation happens as signals land, not after somebody opens a console and notices.How the loop is ordered
- With a causeThe surviving event carries probable cause, the correlated signals and the services affected.What triage produces
- Nothing hiddenEvery suppression is recorded with the rule that caused it, and can be reviewed.A design constraint
What it changes
Correlation is table stakes. What follows it is the product.
Every vendor in this category will tell you they reduce alert noise, and most of them do. The question worth asking in a demo is what the surviving event contains, and what happened to everything that did not survive.
One event instead of one queue
A failing component raises alarms in every tool watching it, so queue length has never described how many things are actually wrong. The join happens in the platform rather than in whichever engineer is awake.
Triage before the page, not after it
The investigation runs before anyone is notified. Waking somebody to begin working out what an alert means is not triage, it is handing over the reading.
Prioritise on business impact, not severity
Services and processes carry an impact value, so what gets attention first can be argued in the language a board already uses rather than in severity levels that mean nothing outside the operations floor.
See what was suppressed
Noise reduction you cannot audit is just noise you cannot see. Every suppressed signal is retained with the rule that suppressed it, so a quiet console can be checked rather than trusted.
How it works
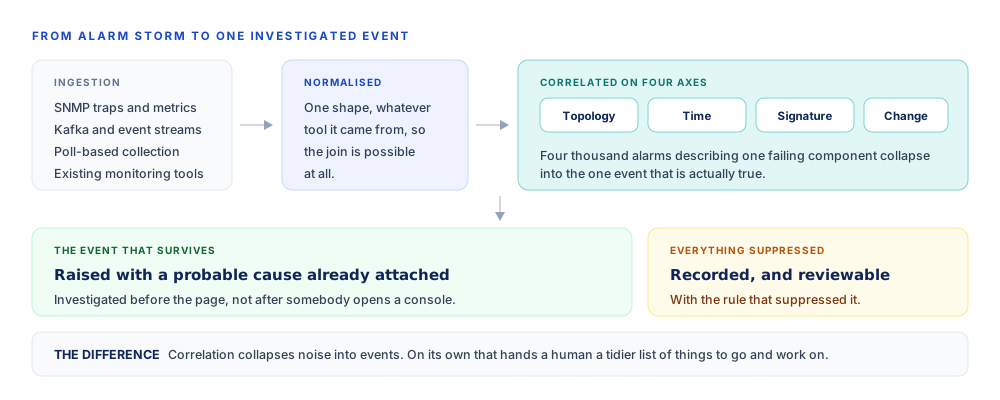
Ingest, normalise, correlate on four axes
Correlating on a time window alone groups things that merely happened together. Adding topology answers what sits upstream of what, signature answers whether this pattern has been seen on this estate before, and change answers the question every bridge call opens with.
Two things worth pushing on
The questions to ask any correlation vendor
Both of these are easy to get wrong in a way that looks excellent in a demo and becomes dangerous in production.
A tidier list is not a smaller problem
Reducing four thousand alarms to one event is a real improvement to the console and no improvement at all to the work. Somebody still has to open that event, work out what it means, find what changed and decide who owns it. The reduction has moved the queue, not the labour.
What makes the difference is whether the event arrives with probable cause, the correlated signals and the affected services already attached, which is a question about what runs after correlation rather than about the correlation itself.
Suppression you cannot audit is a liability
Aggressive noise reduction always looks good in a trial, because the console gets quiet and nobody yet knows what stopped arriving. The failure mode shows up months later, when something genuine was suppressed by a rule nobody remembers writing and there is no record to check.
Every suppressed signal is retained here with the rule that suppressed it and can be reviewed. It is a slightly less impressive demo and a considerably safer system.
Evidence
What is actually recorded
This is the one place on the site where a carrier network deployment is a fair comparison, because correlation across a large multi-vendor estate is exactly what it did. The figures below are that operator's, on that operator's estate.
- 27,000+devices under one pane, previously with no central real-time view
- 3ingestion paths unified: traps and metrics, streams, and polling
- ~60%of incidents auto-created with probable cause and context attached
A Tier‑1 telecom operator. Device count counted at go‑live; the incident share is of raised incidents. The same deployment recorded a 43 percent reduction in MTTR, measured in production six months after go‑live against their documented baseline.
Read the deploymentSee it on a real fault
Four storms this describes
Each one walks a specific event end to end: what arrived, how it was joined, what the surviving event carried and what happened next.
- Service OpsTwo hundred ATM tickets, one upstream causeRead the walkthrough →
- Telemetry OpsFour thousand subscribers dark, four thousand alarmsRead the walkthrough →
- Service OpsThe SLA breached while the ticket sat in a queueRead the walkthrough →
- Service OpsSuccess rate slipped four points. Nobody filed a ticket.Read the walkthrough →
Questions we get asked
Frequently asked questions
Do we have to replace our monitoring tools?
No, and we would advise against it. The platform ingests from the tooling you already run alongside traps, streams and polling, and normalises everything into one shape so the join is possible at all. Replacing detection is expensive, disruptive and does not address the problem, which was never that any individual tool was blind.
What noise reduction percentage should we expect?
We will not quote one, and we would be sceptical of anyone who does before looking at your alert history. The ratio depends almost entirely on how duplicative your current alerting is, which means it measures your existing setup more than it measures the platform. A better question to agree before a trial is what share of raised incidents arrive with a probable cause attached.
How do you avoid suppressing something that mattered?
Partly by correlating on topology and change rather than time proximity alone, which is where most false grouping comes from. Mostly by never treating suppression as deletion: every suppressed signal is retained with the rule that suppressed it and can be reviewed, so a quiet console can be checked rather than trusted.
Does this work for non-infrastructure faults?
Yes, and that is the harder and more valuable case. A business process that stalls between two systems raises no alarm anywhere, because no component failed. Process is a first-class domain here for exactly that reason, and the correlation reaches into ITSM, CMDB and delivery pipelines rather than stopping at telemetry.
Go deeper
Where to read next
Bring us your worst alarm storm
The one that fills the console every few weeks and gets closed in bulk. We will walk through how it would correlate on topology, time, signature and change, and what the surviving event would have carried.